Naphthalene Data (Historical)
About this Data
USACE operated four real-time naphthalene air monitors (UV‑DOAS monitors) from 2012 until the Phase 2 dike construction began in 2021.
These naphthalene units recorded data every 15 minutes. Average levels are computed for a 24-hour period and are compared to Action Levels. From 2012 to 2021:
- Approximately 0.1% of the records had a CDF contribution of naphthalene greater than zero.
- The maximum CDF contribution during this period is an instantaneous concentration of 183 ug/m3. There have been only two instantaneous naphthalene concentrations recorded above 150 ug/m3, but the 24-hour average levels never exceeded either Action Level.
As a result, real-time naphthalene air monitoring was discontinued when Phase 2 dike construction began in 2021. It will not resume when dike construction is complete.
The levels of naphthalene, along with other chemicals of concern, in the sediments have decreased significantly in the last 30 to 40 years, and are expected to continue to decrease in the future due to legacy contaminated material being removed by dredging and regulation of uncontrolled discharges, improved sewage systems, and changes in land use practices.
| Monitor | CDF Side Monitored | Locations |
|---|---|---|
| M1 | North |
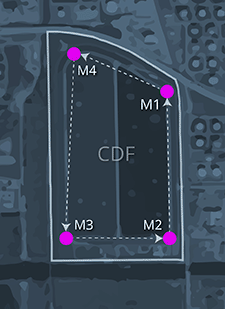 |
| M2 | East |
|
| M3 | South |
|
| M4 | West |
Real-time air monitoring locations. UV‑DOAS monitors collected naphthalene data along an open path between two points between 2012 and May 2021.
