Ambient Air Monitoring Data
USGS Monitoring Data
Summary of Volatile Organic Compound (VOC) Analyses for the Indiana Harbor Ambient Air Monitoring Program: 1st Quarter 2023 (01/01/2023-03/31/2023)HS Air Monitoring Station - all units in parts per billion (ppb)
| Component | Detection Limit |
1/6/23 | 1/18/23 | 1/31/23 | 2/11/23 | 2/23/23 | 3/7/23 | 3/31/23 |
|---|---|---|---|---|---|---|---|---|
| Benzene | 0.5 | ND | 0.39 | 0.28 | ND | ND | ND | ND |
| Toluene | 0.5 | 0.10 | 0.27 | 0.22 | 0.29 | 0.51 | 0.16 | 0.33 |
HS Air Monitoring Station - all units in micrograms per cubic meter (ug/m3)
| Component | Detection Limit |
1/6/23 | 1/18/23 | 1/31/23 | 2/11/23 | 2/23/23 | 3/7/23 | 3/31/23 |
|---|---|---|---|---|---|---|---|---|
| Benzene | 1.6 | ND | 1.24 | 0.89 | ND | ND | ND | ND |
| Toluene | 1.89 | 0.38 | 1.02 | 0.83 | 1.09 | 1.92 | 0.60 | 1.24 |
Footnotes
ND : "Non-Detect" - The chemical compound in the sample was below the Detection Limit, as defined below.
"---" - A sample was not collected at a particular date and location, or that results have not yet returned, or that results were returned but rejected for quality control reasons.
Detection Limit: The Detection Limit shown here actually refers to the laboratory reporting limit, below which the laboratory cannot accurately quantify the concentration of the said parameter.
Units: The unit of measure that each chemical concentration is reported in. Four different units of measure are commonly used to represent concentrations of compounds in air:
- ppb: Part per billion - One part per billion is 1 part in 1,000,000,000
- µg/m3: Micrograms per cubic meter of air – One microgram is 10-6 of a gram
- ng/m3: Nanograms per cubic meter of air – One nanogram is 10-9 of a gram
- pg/m3: Picograms per cubic meter of air – One picogram is 10-12 of a gram
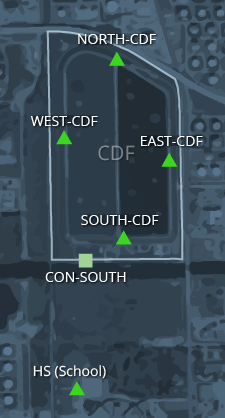
Ambient Air Monitoring Locations: North, South, East, West signify ambient air monitoring locations at the site prior to construction of the CDF. North-CDF, South-CDF, East-CDF, West-CDF signify ambient air monitoring locations with the CDF in place.
About this Data
Ambient air monitoring stations around the CDF monitor long-term concentration trends of selected analytes that fall into several compound classes, including: polycyclic aromatic hydrocarbons (PAHs), volatile organic compounds (VOCs), metals, total suspended particulates (TSP), and polychlorinated biphenyls (PCBs).
During normal operations, high-volume (HI-VOL) vacuum pump air samplers are located at the following locations: 4 at the CDF and 1 at East Chicago High School (NORTH-CDF, EAST-CDF, SOUTH-CDF, WEST-CDF, HS). During dike construction, ambient air monitoring was conducted in one CDF southwest location off dike and at the school (CON-SOUTH, HS). Post dike construction, the air samplers were replaced on top of the expanded dike and air monitoring resumed at the 4 CDF and East Chicago High School locations. Concentrations are compared between locations for variations between construction periods, dredging and non-dredging periods, and seasonal trends.
The U.S. Geological Survey and Argonne National Laboratory maintain an extensive database of ambient air monitoring results from 2001 to present, available above. USACE analyzes all ambient air monitoring results and prepares Ambient Air Monitoring Program reports.