Particulates Data
About this Data
To learn more about how ambient air monitoring data is collected, see Real-Time Air Monitoring.
All exceedances of the site’s air monitoring action levels trigger a check of site conditions and an action, as appropriate, which are documented in a report. Please refer to the Actions Taken page for air monitoring action level exceedance reports.
Actual elevated particulate air monitoring data spikes are due to elevated levels of dust, which can be caused by vehicular or equipment traffic on the site unpaved roads, mowing activities, etc. Dredged materials are primarily submerged under water to control both particulate and volatile emissions. The particulate air monitoring equipment occasionally records false elevated data spikes which are typically caused by insects in the air monitoring equipment, fog or snow in the atmosphere, etc.
| Monitor | CDF Point Monitored | Locations |
|---|---|---|
| M1 | Northeast |
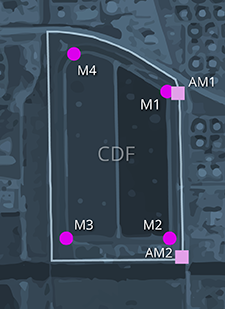 |
| M2 | Southeast |
|
| M3 | Southwest |
|
| M4 | Northwest |
|
| AM1 | Northeast (during dike construction) |
|
| AM2 | Southeast (during dike construction) |
